
 |
 |
 |
 |
 |
 |
 |
 |
 |
|
|
|
||||||||||||||||||||||||||
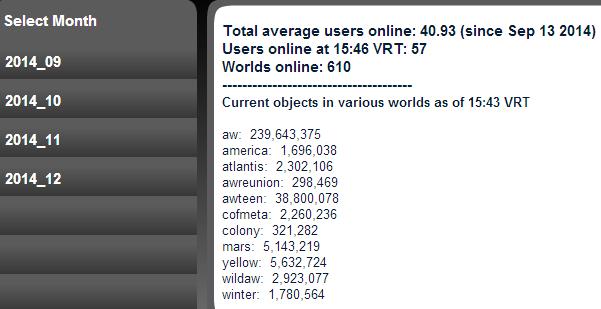
We have started with the third decade of Activewords, and we look back how the year 2015 has been for Activeworlds. For this we can use the website http://pens.sytes.net/aw/ which has been developed by Tomas (#312020) . The statistics website has been started in september 2014. However, since december 2014, the number of users and bots has been merged to together as "number of clients". This has made it a bit more complicated for the statistics. But now for 2015 we can find a whole year of user stats , almost without any interruptions : month after month, day after day, hour after hour. We can also compare with statistics of 2014: http://www.venice3d.net/2014news39.html and also the webpage http://www.venice3d.net/2015news41.html . The first thing that we can analyse is the number of online worlds, which have dropped from 610 worlds in september 2014 (see: http://www.venice3d.net/images/pens2.jpg ) to 577 worlds in january 2016. The new worlds which have been added to the list are using the newest building techniques (PE's, movers , zones, cloth, gravity , color tint, scale, prim objects,..) and will increase the general quality of the worlds in Activeworlds. Since citizenship has become free in june 2013, there is again more interest in starting up a new world. |
|
|||||||||||||||||||||||||
This table shows the total number of clients per day : e.g. "120+" means: more than 120 clients, the number "15" at the right of it , means : 15 days with more then 120 clients. At the top (the upper line) shows the average number of clients for/during the whole month. When you look at this table, you would think that there was a serious decline of users, but when analysing , this is not true. You can see that for january till march, there where a lot of days with more than 130 clients. In april , there was a serious drop of clients, which however was caused by a drop in the number of online bots , and not by a drop of the number of users . Since april, the number of clients has remained at a constant/steady level of 110 clients. In october, a lot of Vista en XP users could not log in, except when they changed their computer date, these problems didn't really cause a drop in users, but there was not a single day with an average above 120 clients. The first 2 weeks of december had started dramatically : 6 days with less than 100 clients. When looking at the statistics website details , you will notice that a lot of bots must have been offline, causing a serious drop of clients. Fortunately, during the christmas weeks, we had again 6 days with more than 120 clients. Finally for december we had an equal number of clients as for the previous months. |
|
|||||||||||||||||||||||||
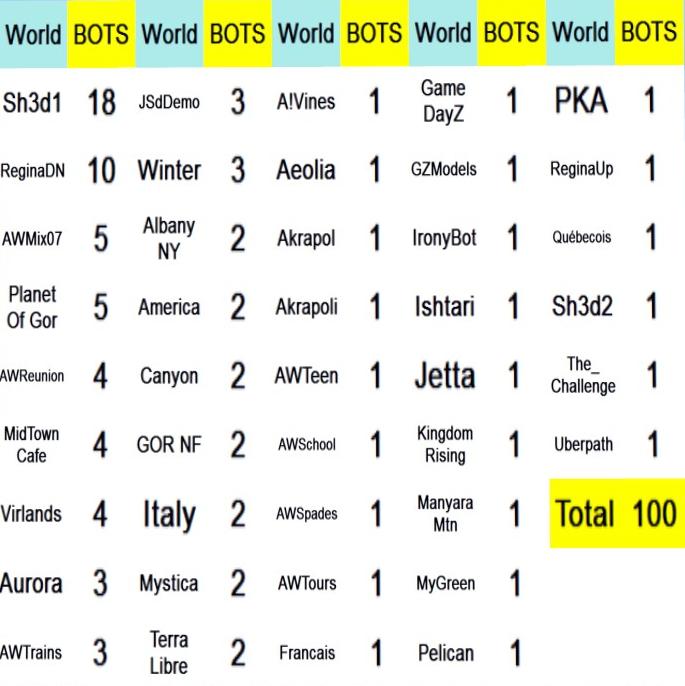
This table shows the number of online bots on 1st january 2016. You can see white numbers and blue numbers. A blue number means that the number of online bots may change from day to day, whereas a white number means that the number of bots remains the same during the whole month. This means that the total number is somewhere between 64 and 108 bots. Most of the bots are not online at the same time . At the right side of the table, you can see the exact number of online bots for the worlds which have a "blue" number, which bring us at a number of online 80 bots for 1st january 2016. This number isn't 100 percent correct : even if everyone would be on your contact list, there are still a few people which have chosen to show themselves "offline" ,even if they are online somewhere, or they are not showing to others in which world they are.
|
|
|||||||||||||||||||||||||
These 2 tables show the same : the purple bar shows the average number of clients for each month , the yellow bar shows the best day of the month , the orange bar shows the weakest day of the month. We already explained that for january, february and march , we had an average of 100 bots instead of 80 bots, after deduction of the number of bots, you will see a steady line during the whole year. The numbers on the blue cubes are showing the visitor peak hours during each month. These peak hours are usually reached during special events : the 2-monthly AW Community Meetings, the monthly Birthday Parties, the AW Community Picture on 27th june , and the Hollywood Tower Hotel event on 31st december. The best news for 2015 is perhaps the visitors peak of 161 clients on 15th november. After deduction of the 80 bots , we can say that there were 81 users , which is the highest number since the startup of the AW statistics website in september 2014. We would rather say that the activities in Activeworlds have remained stable and that 2016 will be a new challenge for us. |
|
|||||||||||||||||||||||||
 |
||||||


